
Runtime bugs: when the first 30 minutes are critical
A stuck I/O incident looked invisible in logs, metrics, and traces. The useful evidence came from reproducing the hang, forcing a core dump, and looking at it in GDB.
A few requests are timing out.
Error rates are climbing.
Dashboards say "stuck I/O".
You spend an hour gathering logs, metrics and traces for the request.
Traces end in waiting spans. The logs say almost nothing, because nothing is crashing.
There are no errors to grep.
This is where investigations into runtime bugs in production conclude.
And that is exactly why the first 30 minutes after an alert fires really matters.
If the process is still running, the whole truth is still in memory.
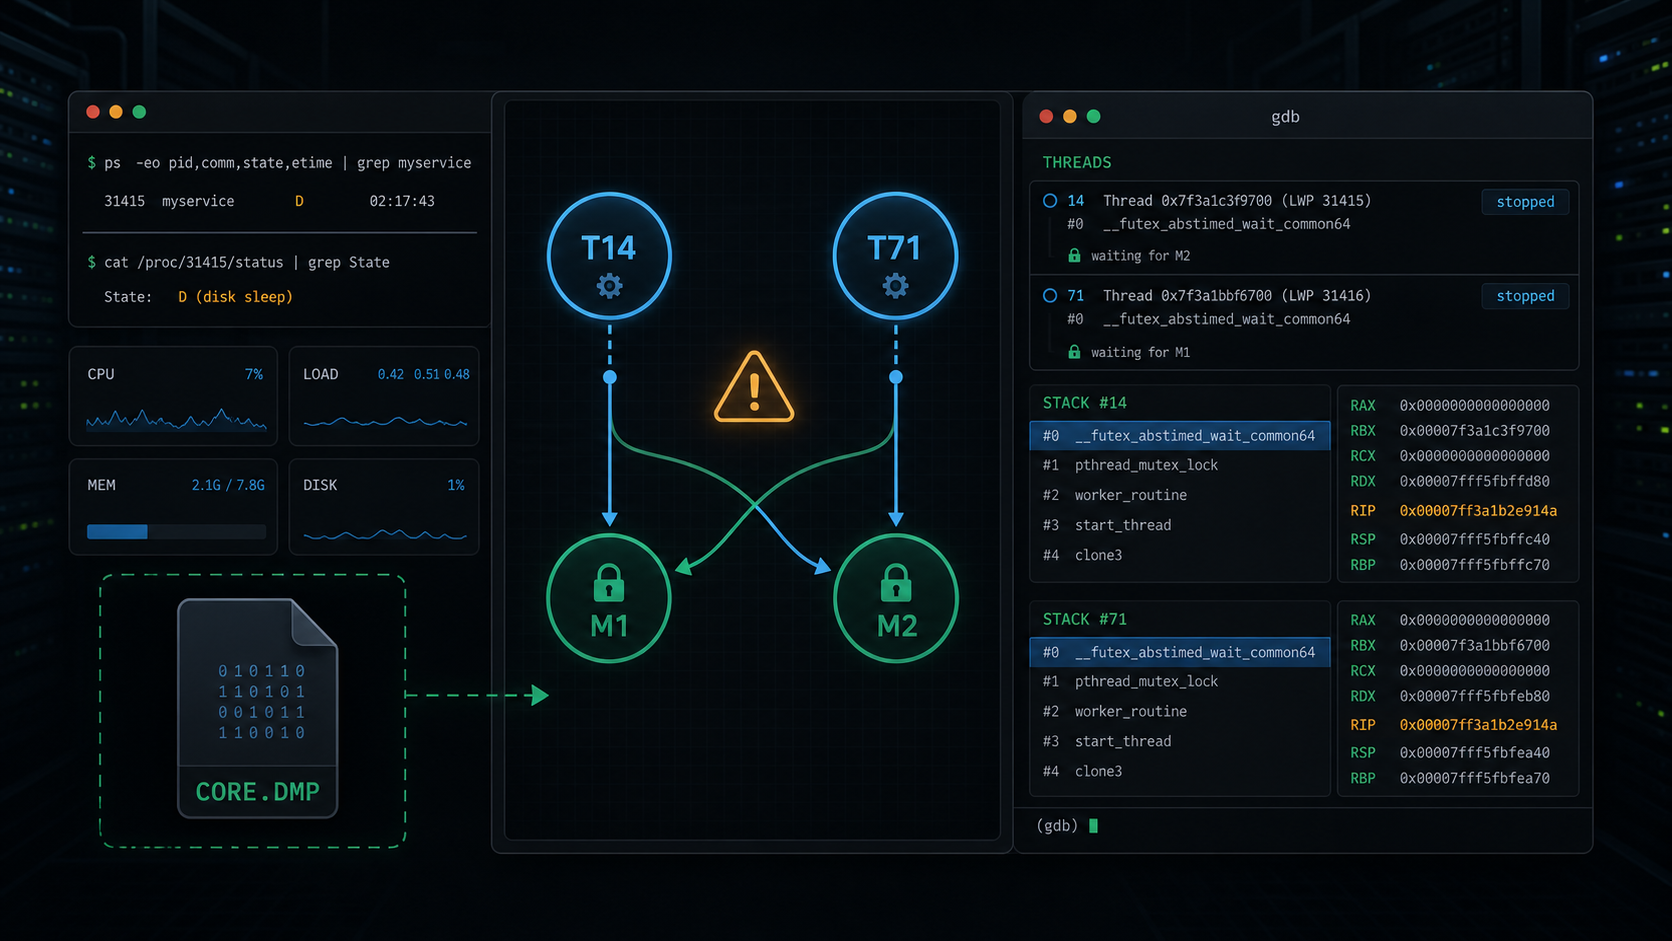
observability yields no 'aha' moment
The bug showed up as stuck I/O.
Requests entered the service and then sat there.
The trace spans made the storage layer look suspicious.
But after going through everything there was but one validated fact:
The service is not making progress.
They could not answer the question that mattered: why.
To answer this question, you have to enter the live environment and experiment.
ip tunnelling into orbit
If you can get to the affected machine in the minutes after the bug appears, you still have the evidence most teams accidentally delete.
Experienced engineers already know this.
Take the affected replica out of traffic. Keep the host warm.
Then capture the process state.
# less destructive snapshot, if gcore is available
sudo gcore -o /var/tmp/myservice.core "$(pidof myservice)"

# or, when the replica is already wedged and safe to crash,
# abort intentionally so the runtime writes a core dump
sudo kill -ABRT "$(pidof myservice)"
Open the binary and the dump:
gdb /opt/myservice/bin/myservice /var/tmp/myservice.core.31415
At this point, you are no longer asking the observability stack what happened.
You are interrogating the process that failed.
the stack is not proof
The first gdb pass was suggestive.
(gdb) info threads
  14 Thread 0x7f3a1c3f9700 (LWP 31471)  __futex_abstimed_wait_common64
  71 Thread 0x7f3a1bbf6700 (LWP 31528)  __futex_abstimed_wait_common64
Thread 14 looked like this:
main()
  process_data()
    std::mutex::lock()
      __pthread_mutex_lock_full()
        __futex_abstimed_wait_common64()
          BLOCKED
Hmm.. stuck.. waiting on a mutex.
You spend some more time looking around to see what was happening in the system.
And then you spot something else.
Thread 71 was also stuck in mutex wait:
main()
  clear_cache()
    std::mutex::lock()
      __pthread_mutex_lock_full()
        __futex_abstimed_wait_common64()
          BLOCKED
You lookup the code for process_data() and clear_cache().
std::mutex metadata_mu;
std::mutex cache_mu;

void process_data() {
    // Wall of code
    std::lock_guard<std::mutex> a(metadata_mu);
    // Wall of code
    write_metadata();
    // Wall of code
    std::lock_guard<std::mutex> b(cache_mu);
    update_cache_index();
}

void clear_cache() {
    // Wall of code
    std::lock_guard<std::mutex> b(cache_mu);
    // Wall of code
    std::lock_guard<std::mutex> a(metadata_mu);
    rewrite_metadata();
}
Both threads are waiting on the same process-level lock.

Cold, warm, hot
The next move is to inspect the mutex object itself.
First, switch to Thread 14 and find the mutex it is trying to acquire.
(gdb) thread 14
[Switching to thread 14 (LWP 31471)]

(gdb) bt
#0  __futex_abstimed_wait_common64
#1  __pthread_mutex_lock_full
#2  std::mutex::lock()
#3  process_data()
#4  main()

(gdb) frame 1
#1  __pthread_mutex_lock_full (mutex=0x00007f4c2a40b8d0)

(gdb) p mutex
$1 = (pthread_mutex_t *) 0x00007f4c2a40b8d0
Then look at the mutex internals.
On glibc, pthread_mutex_t carries an owner field. It stores the owner LWP, so you match it back against info threads.
(gdb) p ((pthread_mutex_t *)0x00007f4c2a40b8d0)->__data.__owner
$2 = 31528
31528 is Thread 71's LWP.
So Thread 14 is blocked on a mutex owned by Thread 71.
Now do the same thing from Thread 71.
(gdb) thread 71
[Switching to thread 71 (LWP 31528)]

(gdb) bt
#0  __futex_abstimed_wait_common64
#1  __pthread_mutex_lock_full
#2  std::mutex::lock()
#3  clear_cache()
#4  main()

(gdb) frame 1
#1  __pthread_mutex_lock_full (mutex=0x00007f4c2a417920)

(gdb) p mutex
$3 = (pthread_mutex_t *) 0x00007f4c2a417920

(gdb) p ((pthread_mutex_t *)0x00007f4c2a417920)->__data.__owner
$4 = 31471
31471 is Thread 14's LWP.
It's a deadlock.
Thread 14 waits on M1. M1 is owned by Thread 71.
Thread 71 waits on M2. M2 is owned by Thread 14.
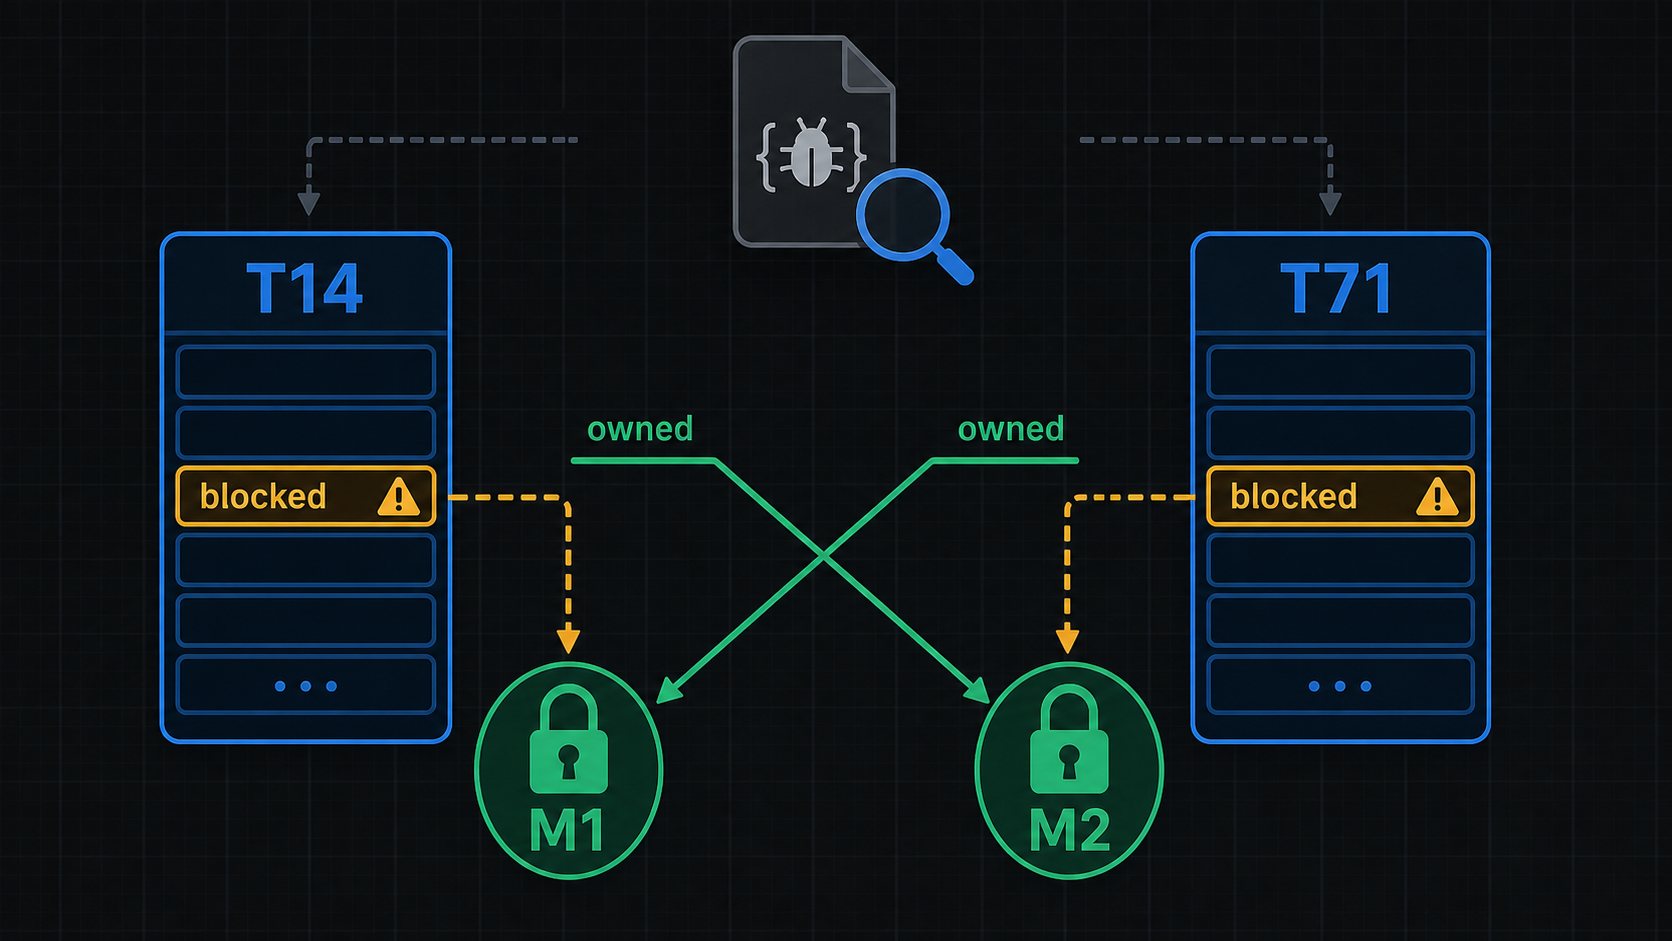
logs can't capture everything
For this class of incident, the useful workflow is short:
1. Keep the affected process alive.
2. Remove it from traffic if needed.
3. Capture a core dump.
4. Capture kernel logs, process logs, take a ps dump, whatever may be relevant based on your hunch.
5. Solve the bug.
6. Ask your boss for a raise.
If you stare at the data dump produced by observability for an hour, the host may be replaced, the process may be gone, and you missed the chance to fix the bug.
By then you are no longer debugging the system that failed.
You are hoping observability data will give you all the necessary information.
where agents should help
This is where AI agents can make a real difference.
Not just "summarize the incident after the fact."
That is useful, but late.
The useful agent arrives while the process is still warm. It notices the stuck-I/O shape, preserves the live state, asks for permission before destructive steps, captures the core, and creates a bug with its findings.
Hypothesis: lock inversion between process_data() and clear_cache()
Evidence:
  - Thread 14 blocked in pthread_mutex_lock
  - Thread 71 blocked in pthread_mutex_lock
  - M1 owner LWP = 31528 -> gdb thread 71
  - M2 owner LWP = 31471 -> gdb thread 14
Next test:
  - enforce lock ordering or avoid nested locks, then reproduce under stress
That is the shape we are building toward with FixBugs: not a prettier incident summary, but a debugging agent that preserves volatile evidence, experiments, hypothesizes and interacts with the application to reproduce the bug.
The worst bugs do not always shout in logs. Sometimes they sit quietly in memory, beyond the reach of observability.